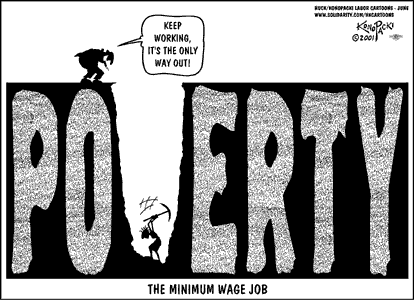
The last time the federal minimum wage was raised was July 24, 2009, to $7.25 per hour.
Workers making the minimum wage have been facing a continual pay cut
since then, as inflation has eroded the purchasing power of the minimum
wage.
The first minimum wage pay cut clock shows how many dollars America's minimum wage workers have lost since July 2009. Every second it shows how much more money they're losing, as long as the federal minimum wage remains stuck at $7.25. Mind you, even if the federal minimum wage were to catch up to its July 2009 level, it would still be far below its historical level. The peak year for the U.S. minimum wage was 1968.
The second clock shows how many dollars America's minimum wage workers have lost since July 24, 2009 if the minimum wage had instead been raised to its 1968 level and then kept pace with inflation since then. Every second it shows how much more money they're losing, as long as the federal minimum wage remains below its historical peak.
See here.

No comments:
Post a Comment